Follow a program with the debugger
Attach Debugger on a task of a controller: the task shown running or paused, the program opened at its line, the registers, variables and I/O of the frame, breakpoints in the gutter, Continue, Step and Pause with their confirmations, the limits of a Fanuc controller, the warning when the file differs from the controller, the launch configuration, and what Yaskawa gives: the stack, the step and the running job, read only.
This page explains how to follow a program that a controller runs, and how to stop it at a line, with the debugger of VS Code: TouchUp: Attach Debugger, the Call Stack of a task, the program opened at its line, the Variables view, breakpoints, Continue, Step and Pause. Following a task only reads. Breakpoints, Continue, Step and Pause change the state of the program: they are Pro actions and they ask you to confirm. They are available on Fanuc controllers. A Yaskawa controller is followed read only: its Call Stack, its step and the running job are shown, and breakpoints, Continue, Step and Pause are not available, see Yaskawa.
What it shows
The debugger follows one task of a connected controller, for example MAIN.
- The task, running or paused. The debugger shows the task as the controller has it. A running task is shown running, with the button
Pausein the debug toolbar. A task that is paused, at a breakpoint, after a Step or by the pendant, is shown stopped, withContinue,Step OverandStep Into. - Call Stack. One thread for the followed task. The stack is shown while the task is paused: the program that runs now first, then the programs that called it, each with its line. The
Tasksnode of the Controllers view lists the same stack the other way round: the first program of the task is the top row. - The program at its line. A click on a frame opens the program at that line. TouchUp opens the file of your workspace with the same name when there is one, and the program of the controller otherwise. The lines of a TP program are the lines of its listing. The frame says
(file differs from the controller)when the file of your workspace is not the program that runs, see When the file differs from the controller. - Variables. Select a frame to see the groups
Registers,VariablesandI/O. A group is listed when the program of the frame names something of that kind. It holds the values of those names, read from the controller when you open the group, up to a limit. A value that is older than 2 seconds says so.
Attach the debugger
- Connect the controller.
- Open the
Tasksnode of the controller in the Controllers view, right click a task, thenAttach Debugger.
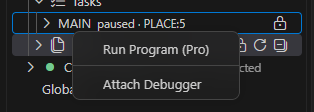
- VS Code shows the debug toolbar. Open the
Run and Debugview to see the Call Stack of the task. Attaching writes nothing to the controller.
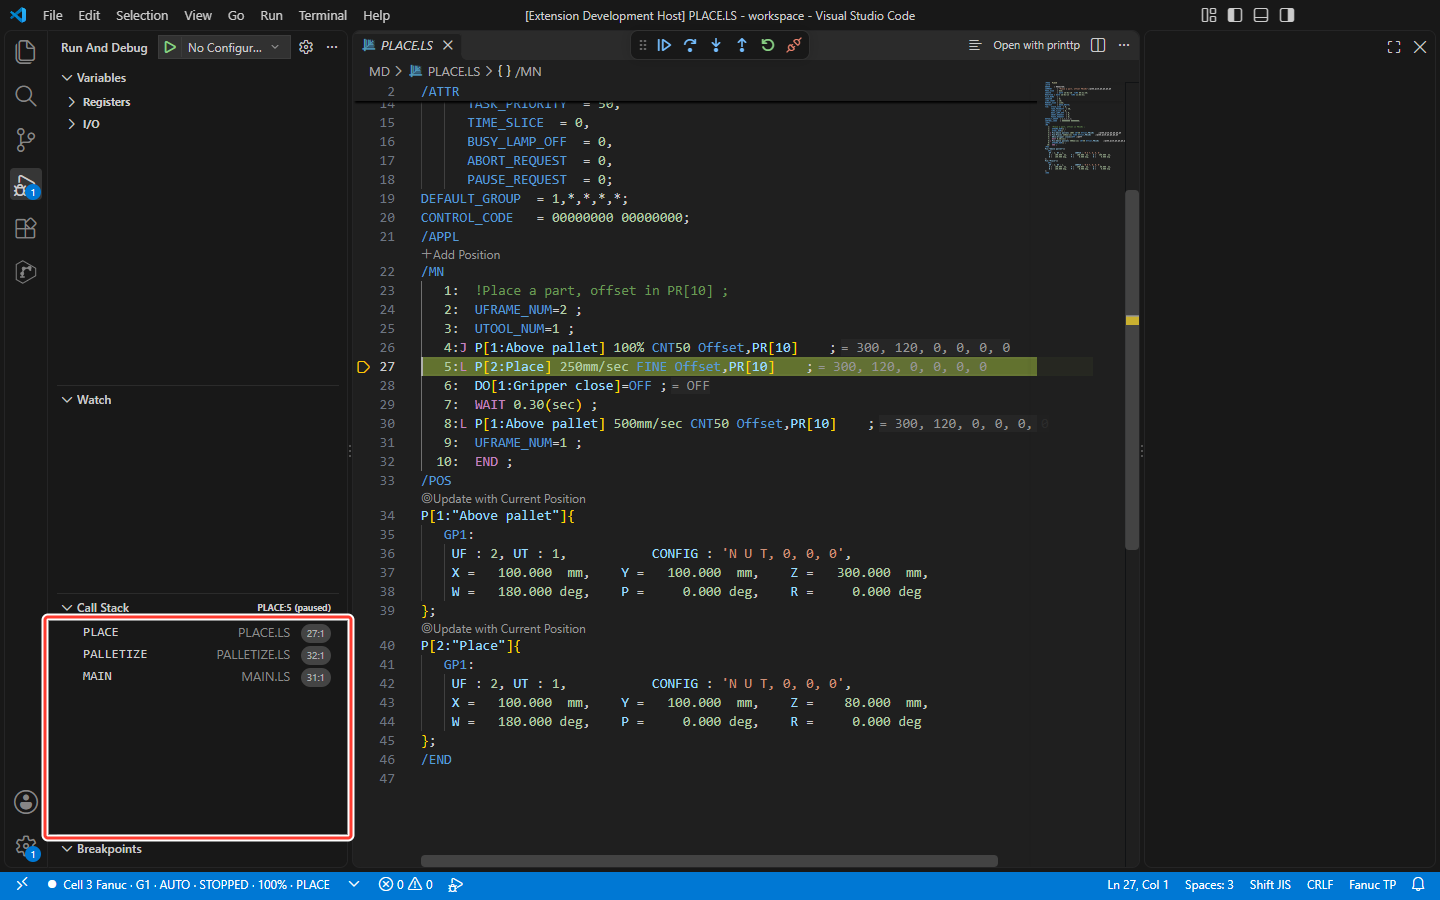
Without the tree, run TouchUp: Attach Debugger in the Command Palette. It works on the active controller. When the controller reports several tasks, a list Task of <controller> asks which one to follow. When it reports one, TouchUp follows it.
A launch configuration does the same. Add the snippet TouchUp: Attach to a Task to .vscode/launch.json, then give the controller (its id in .touchup/config.json) and the task:
{"type": "touchup","request": "attach","name": "Attach to MAIN","controller": "controller-id","task": "MAIN"}
When it does not start
TouchUp says why, and sends nothing to the controller:
<controller> is not connected: connect it, then attach the debugger.Attach Debugger is not available on this controller:and the reason, when the controller does not offer the debugger.<controller> reports no task to follow.Open theTasksnode to see what the controller reports.No controller declared: add one in .touchup/config.json.
Breakpoints, Continue, Step and Pause
These actions change the state of the program on a Fanuc controller. They need the Pro edition for Fanuc, and a controller that takes KCL commands, through its web server from firmware V9.30 or through Telnet. Without them, the reason is given where you click: the breakpoint is shown as not set, with the reason, and Continue, Step and Pause say why they are not sent. A simulated controller is never locked. See Editions and license.
| Action | How | Confirmation |
|---|---|---|
| Set or remove a breakpoint | Click in the gutter of a program (.ls TP program, .kl Karel source) | The first change of the session only |
Continue | The button of the debug toolbar | Every time |
Step Over, Step Into | The buttons of the debug toolbar. Both run one line | Every time |
Pause | The button of the debug toolbar | Every time |
There is no Step Out: asked, the debugger says that Step Over and Step Into both run one line.
A step can move the robot. The confirmation says so: check that the cell is clear and safe first. Pause pauses the running programs of the controller, not the followed task only. Continue starts them again from where they stopped.
The first change of breakpoints
The first change of breakpoints of a debug session opens a confirmation. It lists, for each program, the lines of its breakpoints on the controller (as last read), the lines in your editor, and what the change does to them. The next changes of the same session do not ask again. Cancel: nothing is sent, and the breakpoints stay in the gutter as not set.
- The breakpoints that are in the gutter when you attach are sent at once, and share this first confirmation.
- The list of breakpoints of a file replaces those of its program on the controller. A program that the change does not touch stays as it is, and the list says so.
- When the file differs from the program of the controller, the confirmation shows the warning below.
- Without the Pro edition, a click in the gutter opens the dialog of TouchUp Pro and the Debug Console says
Breakpoints need TouchUp Pro. Nothing is sent.
Continue, Step and Pause ask each time: the dialog shows the controller, its mode and what happens, and Cancel has the focus. Every change of breakpoints and every one of these actions is recorded in the audit log.
What is sent
- A breakpoint on a line that is not an instruction (a header,
/POS, an empty line) is not sent. Put it on a numbered line of a TP program. - A breakpoint with a condition, a hit count or a log message is not sent: it is shown as not set, with
TouchUp breakpoints have no condition and no log message. Only plain breakpoints are set. - One file holds the breakpoints of one program in a session. A second file of the same program is refused:
the breakpoints of PICK are in PICK.LS. - TouchUp sets at most 32 breakpoints in a program, and keeps the breakpoints of at most 16 programs in a session.
- A breakpoint that was set at the pendant, in a program that TouchUp has not touched, stays as it is. TouchUp does not own it and never removes it. A breakpoint of yours on that line is refused:
already set on the controller, not by TouchUp. - The controller removes the breakpoints of a task when the task is aborted. TouchUp reads them back and shows the real state in the gutter.
- When the controller does not answer a change, TouchUp says that the outcome is unknown and keeps the lines that may be set: check the controller.
When the task reaches a breakpoint it pauses. VS Code shows the line, the stack and the values.
When the file differs from the controller
TouchUp compares the file that you debug with the program on the controller, with a read that writes nothing. When they differ, the frame of the Call Stack says (file differs from the controller), and the Debug Console explains it once for the program: the lines that the debugger shows, and the lines of its breakpoints, may not be the lines that run. TouchUp does not try to match them. The breakpoints of that file are still set, with the message that the program may stop on another line.
The comparison ignores what does not change the program: line endings, spaces at the end of a line, and what the controller rewrites itself (dates, the size, the LINE_COUNT of a TP program). The line numbers are compared. A Karel file is not compared, and neither is a program that cannot be read from the controller.
What to do:
- If the file in your editor is the right version, send it to the controller: see Send a file to the controller.
- To see what runs now, open the program from the
Filesnode of the controller, see Open controller files.
A program that matched is not compared again while the text of the editor stays the same: a change made at the pendant in the meantime is seen when you edit the file.
Stop
Use the disconnect button of the debug toolbar, Detach. The program keeps running. TouchUp removes the breakpoints that it set and ends the step mode: the breakpoints that it did not set stay. When something may stay on the controller, TouchUp says so: the debugger left <task> on <controller>, with the reason. Check the controller then: a breakpoint or the step mode may still stop the program.
When TouchUp loses the connection to the controller, the session ends with the message TouchUp lost the connection to <controller>: the debug session ended. The program keeps running.
Yaskawa
A Yaskawa controller is followed read only. Attach Debugger works as above on the master task or a sub task of the Tasks node, in every mode of the controller, and the Variables of the debugger work too. Nothing in the debugger can start, stop or move a job. What the controller gives is shown, and what it does not give is said.
- The Call Stack of the job. The running job is first, then the jobs that called it, down to the job that the task started with, for example
SUB2,SUB1,MAIN. In theTasksnode of the Controllers view, the same stack is listed the other way round: the first job of the task (MAIN) is the top row. This order is the same on Fanuc. - The step. The frame of the running job and the row of the task show the step of the job, for example
(step 4)in the Call Stack andstep 4on the task row. - The line of a calling job. The controller gives the line of the running job only. For a job that called the next one, TouchUp reads the job and shows the line of its
CALLof the next job, only when the job has exactly one suchCALL(aCALLwith a condition counts, a comment does not). When it has several, the frame says(line unknown: CALL SUB1 on lines 5, 9): these are the lines where the call can be. When TouchUp cannot be sure, for example because the job also calls a job by a variable, or when it cannot read the job, the frame says(line unknown). TouchUp never shows a line that it guessed. - The editor follows the running job. While a job runs, TouchUp opens the running job in the editor, at its line, without taking the focus from what you type. It does this only when the job stays the running job for about 1 second, so that a job that calls many short jobs does not swap your editor all the time. A job is never replaced in your editor when it holds a change that you did not save. When the job is held at the pendant, the Call Stack shows the stack as above. A Fanuc task is not followed this way: TouchUp opens its program when you click a frame, not by itself.
The controller gives TouchUp no way to stop a job at a line. A breakpoint in the gutter of a job is shown as not set: Breakpoints are not available on a Yaskawa controller. Continue, Step and Pause answer are not available on a Yaskawa controller: TouchUp follows the job read only, and nothing is sent. Use the pendant to stop and start the job. The evaluation of an expression is not available on any controller.